A simple two-step reaction

A --- B --- C

A turns into B, with rate constant k1, which turns into C, with rate constant k2.

If k1 is slow and k2 is fast, then the concentration of B is always low, as is illustrated in this figure.
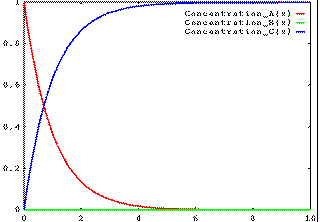
k1=1, k2=5

Alternatively, if k1 is fast and k2 is slow, then the concentration of B will build up, then fall away:
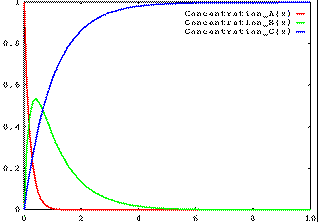
k1=5, k2=1

To experiment with different values of k1 and k2, type:

demo1 k1 k2


An animation of the effect of changing the values of k1 and k2 is also available. Type:

demo2

The demo version is rather smoother than this image:
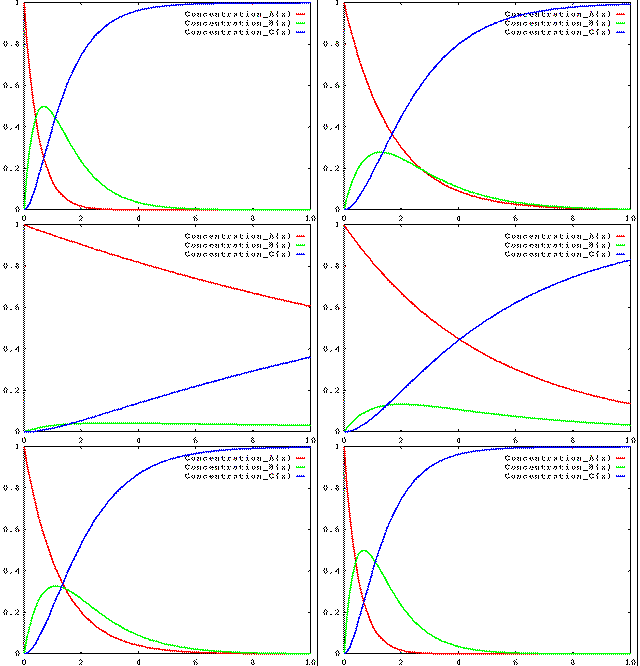
animation

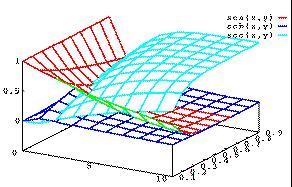
It is also possible to display the effect of changing the ratio of k1 and k2 on a three-dimensional graph. The graph can be rotated by Gnuplot. The underside of the red surface is coloured green, the underside of the blue surface is magenta, and the underside of the cyan surface is brown. To run the demonstration, type:

demo3d

3D plot

These graphs were created using Gnuplot

Next Example


© 1997 J M Goodman
Cambridge Chemistry Home Page Silicon Graphics Teaching Laboratory Structures Teaching Webmaster