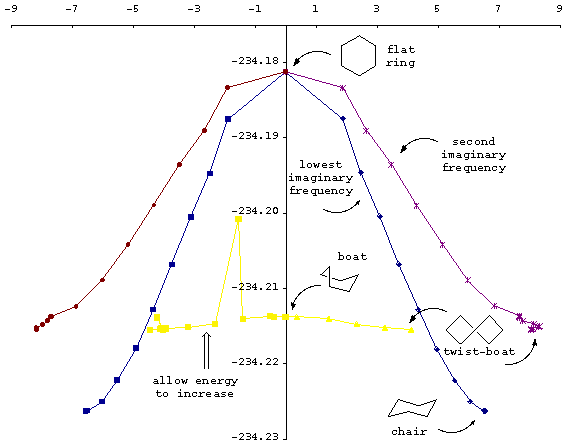
QRC: Quick Reaction CoordinateCyclohexane exampleJ M Goodman and M A Silva Tetrahedron Letters 2003, 44, 8233-8236.Cyclohexane has two minima in its potential energy surface - a chair and a twist boat. It also has conformational transition states. This example examines the cyclohexane potential energy surface using RHF/6-31G** as implemented in Jaguar. The symmetrical boat conformation has one imaginary frequency. The QRC follows this direction to the twist-boat minimum. The flat hexagon of carbon atoms has three imaginary frequencies. The lowest of these is traced by the QRC to the chair conformation, and the second and third (which are degenerate) lead to the twist boat.
Procedure flatfreq.out boatfreq.outFreqQRC was used first: FreqQRC flatfreq.outThis creates a new file flatfreq.fdt which contains the geometry of the molecule, the changes found from the frequencies, and the two distorted geometries, one adding and one subtracting the distortions. The new geometries were cut and pasted into new Jaguar input files, and minimised. The outputs were flatfreq_add.out and flatfreq_sub.out. Now, FindQRC was used: FindQRC flatfreq_add.out flatfreq.fdtThis creates a new file flatfreq_add.qrc. The first column is the energy of each structure, and the next columns are different ways of measuring the distance between adjacent structures. The second column is mass-weighted rms distance from the starting structure, and we have found this to be the most effective. The third column gives the sum of the distances between adjacent structures, and is similar but slightly larger. The fourth and fifth columns are non-mass-weighted versions of the second and third. The figure above shows, in blue, the effect of plotting the energies against the distances in the second column (mass-weighted distances from the initial structure). If the corresponding calculation is done on flatfreq_sub, the same result is obtained (shown in the figure with negative distances) because this system is symmetrical. In general, adding and substracting the frequencies may give different results. The structure at zero-distance is the transition state read from the flatfreq.fdt file, and this is why this file is mentioned after the FindQRC command.
Variations FreqQRC boatfreq.out 0.2This multiplies each of the distortions by 0.2 before adding and substracting them. FreqQRC boatfreq.out 1.0 is equivalent to FreqQRC boatfreq.out, as the default is to use the distortions calculated by Jaguar directly. Some structures, including flatfreq.out have more than one imaginary frequency. By default, FreqQRC uses the first frequency, but higher frequencies may be selected using the -f flag. For example: FreqQRC flatfreq.out -f2generates a flatfreq.fdt file containing distortions based on the second lowest frequency reported by Jaguar. In this example, this is also an imaginary frequency, and the results of following the FindQRC procedure are also shown in the figure, in purple. The lowest frequency leads to the chair conformation, and the second lowest to the twist boat. FindQRC: The usual form for the FindQRC command includes an .fdt file: FindQRC flatfreq_add.out flatfreq.fdtHowever, the .fdt file can be omitted, and the calculation reports distances from the first distorted structure. By default, FindQRC omits points for which the energy goes up as the minimisation progresses. Occasionally it can be useful to visualise these points too, and this can be done using the -u flag: FindQRC flatfreq_add.out flatfreq.fdt -uThis has been done for the left-hand section of the yellow line in the figure. This line would be a reflection of the right-hand half if it had been generated without the -u flag. © 2003 J M Goodman, Cambridge 


|